Give your labels some space
In my recent post, MM Week 47: My First Custom Color Palette, I made mention of a few tips for labeling line charts to improve the user experience and promised a follow-up post with more detail. Interestingly, while researching for this post, I found a better solution than the one I used. This is maybe the best part about blogging!
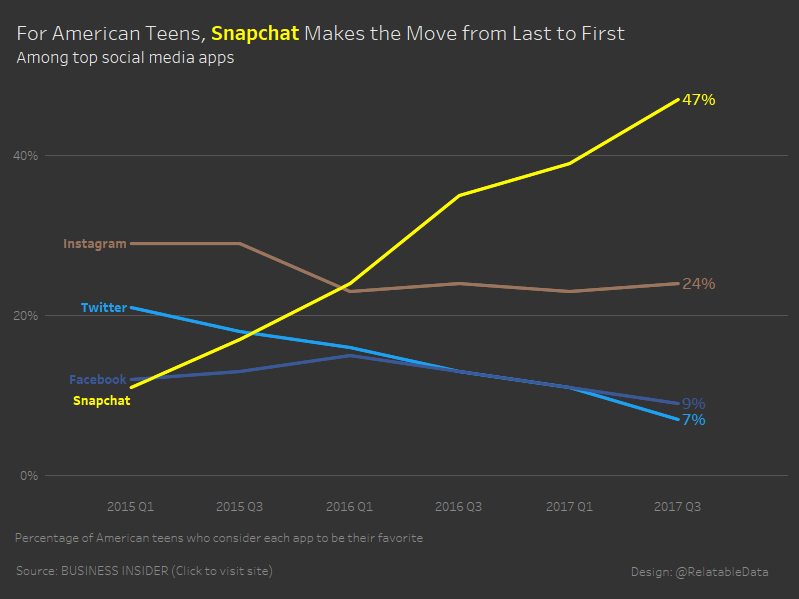
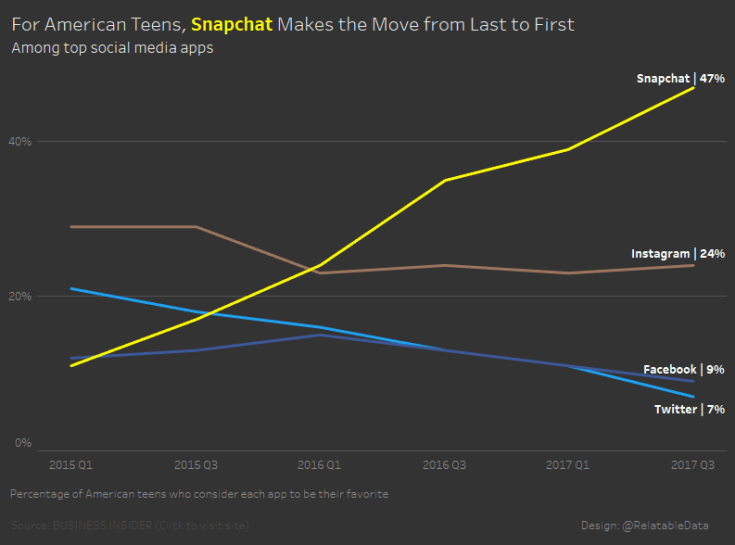
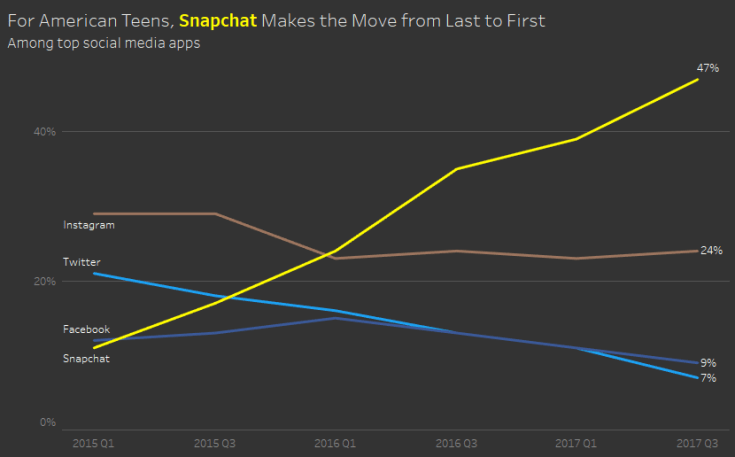
I’ve updated my MM Week 47 (2017) submission: “For American Teens, Snapchat Makes the Move from Last to First,” to use this new solution and have outlined those steps below. I recommend you find the time to watch this Tableau Tip Tuesday from Andy Kriebel (@VizWizBI). He hits on three great tips. I use his first tip in the third bullet below.
- Adding context within the boundaries of default settings
- Using dual axes to improve user experience
- Implementing Andy’s tip
Adding context within the boundaries of default settings: It feels overcrowded
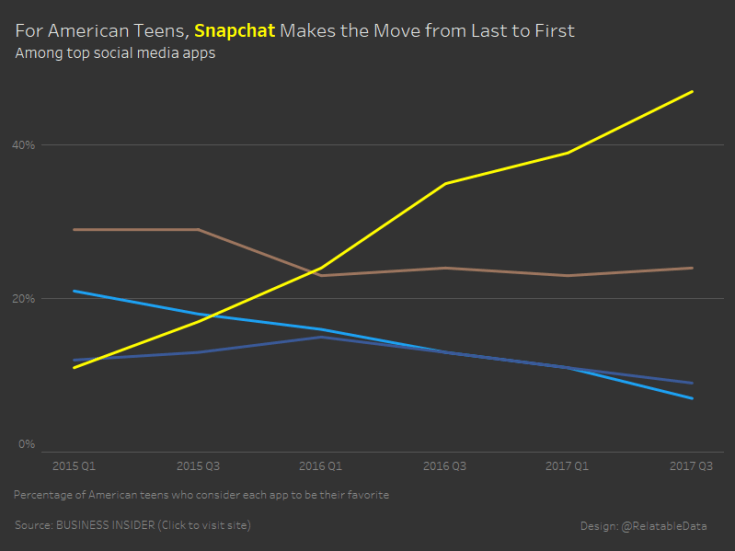
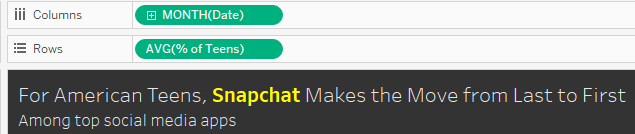
Here is the starting point for this blog. Feel free to download the dashboard in this state and follow along.
Click the image below and download from Tableau Public to follow along
- If you like to read more about color choice and how to create a custom color palette, see my initial post on this viz: “MM Week 47: My First Custom Color Palette.”
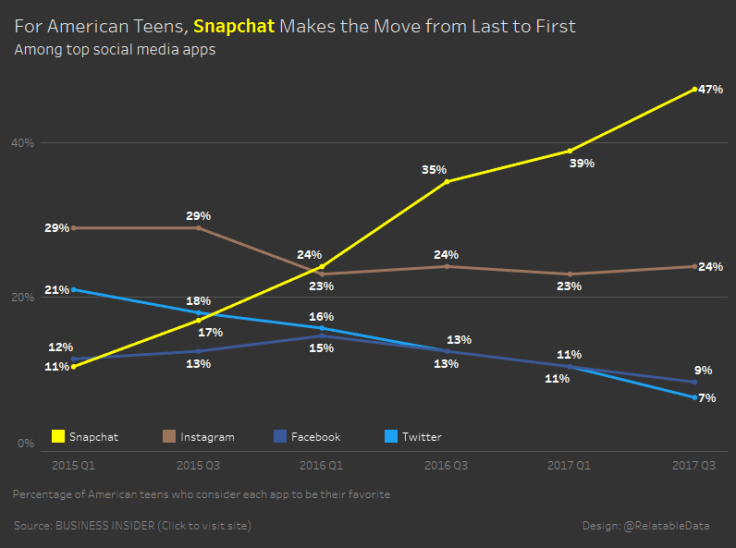
There are two key elements missing from this view; an indication as to what each color represents and, given the wide scale on the vertical axis, you could say more precise values would help. To solve this you might show the color legend and add the measure, AVG(% of Teens), to Label.

Doing so, even with some tweaks to fit the legend and format the labels, still leaves me with a feeling of incompleteness.
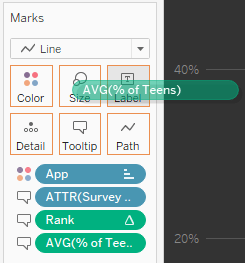
I am not a fan of color legends, so my instinct is to place the dimension on the label along with the measure. In this case, we can place App and AVG(% of Teens) on label together. With some minor editing to the text, we can create a simple label.

Tableau default settings will do some helpful things here to minimize the overcrowded feel, such as only displaying labels for the most recent date once a dimension is placed on label, but there is still work to be done.
While Tableau has gotten us most of the way there, I would ideally place App at the left end of the lines and AVG(% of Teens) on the right end. Why? I’m catering to my audience here. In western culture, we read left to right. My goal, since the majority of my audience in accustomed to reading left to right, is to present my information as I would anticipate my audience ‘needing’ it: App > trend > most recent value for AVG(% of Teens).
We are not going to accomplish this in the current set-up. Some simple adjustments are required.
Using dual axes to improve user experience: If I have two sets of lines, I can have two distinct sets of labels
A dual axis chart is typically used to compare two measures in a single viz.
Quick aside: Making comparisons with dual axes can be tricky and may require some ethical considerations. Be sure you are not misleading your audience when comparing two measures on a dual axis. For further reading, see this example of a misleading dual axis chart outlined by Steve Wexler (@VizBizWiz), Be Careful with Dual Axis Charts.
In our case, we will draw no such comparison and therefore do not have to concern ourselves with potentially misleading our audience; in fact, what we are doing is intended to reduce the possibility that our audience misinterprets our data.
Creating a dual axis chart using the same measure twice:
- Hover over the green AVG(% of Teens) pill on the rows shelf and, while holding the CTRL key, drag the pill and place it on the same rows shelf directly to the right of the first pill.
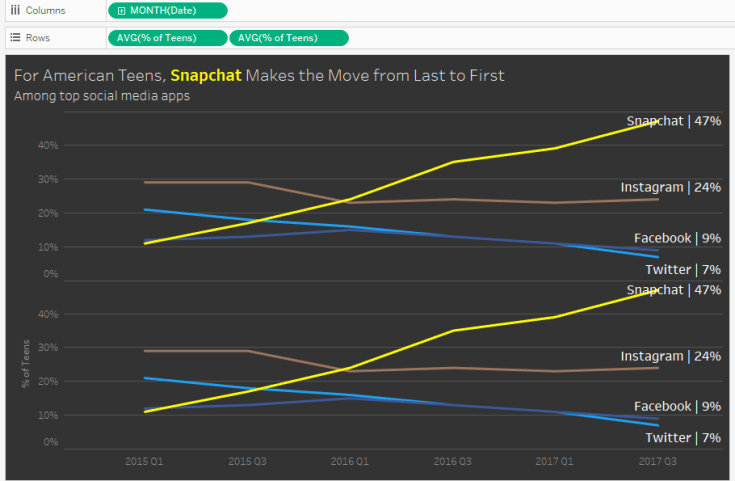
We now have our second axis - Doing so creates a second identical chart. Right-click the vertical axis on the lower chart and select ‘Dual Axis’ to overlay the two charts.
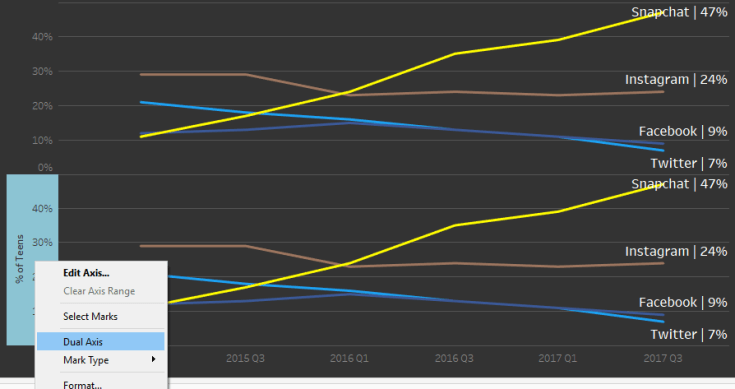
- Once the two charts are on a dual axis, they may or may not be perfectly aligned. Even if they are perfectly aligned, you should make sure to synchronize the axes. To do so, right-click the vertical axis on the right and select ‘Synchronize Axes’.
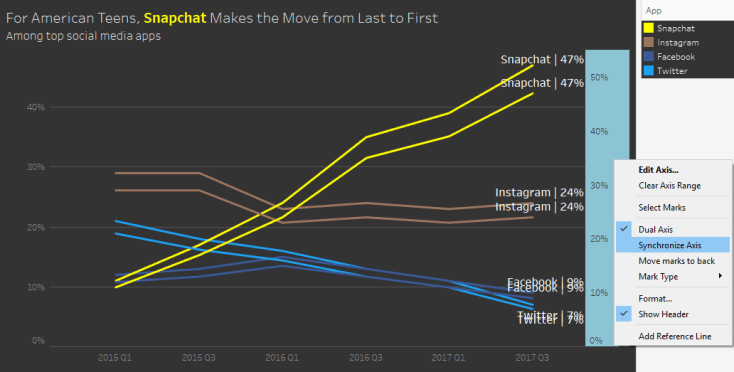
- From here, to clean things up a bit, right-click the vertical axis to the right one more time and click ‘Show Header.’ Doing so will uncheck ‘Show Header’ and the vertical axes to the right will be hidden.
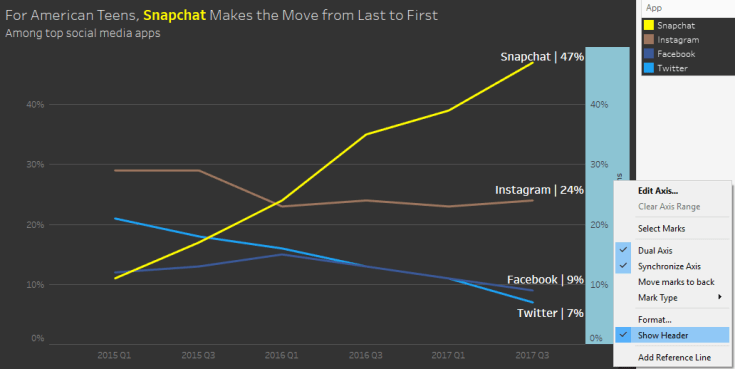
We now have two charts perfectly overlapping one another. The beauty of this trick is that we can uniquely format the labels on each chart. Our plan is to put App on the left and AVG(% of Teens) on the right. As a result, it will appear as though we have unique labels on each end of our lines.
Let’s start with a brief overview of how to toggle between the two sets of overlapping lines so we can be sure we are updating the correct labels as we work.
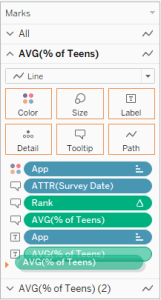
You can click the pills on the rows shelf or use the Marks card to toggle. You’ll see that each measure has its own Marks card. Because we added labels before creating the dual axis, those labels now apply to both sets of lines.

![]()


Our first goal is to format the first set of lines to show App at the start of each line. Make sure you have selected the first AVG(% of Teens).
- To show the label only on the left end, click Label and select Line Ends and uncheck the box beside ‘Label end of line’.
- Then remove AVG(% of Teens) from Label
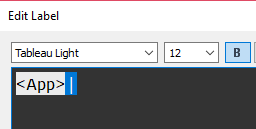
- Lastly, delete the’|’ we had used to separate App and AVG(% of Teens) in the first draft of our label.
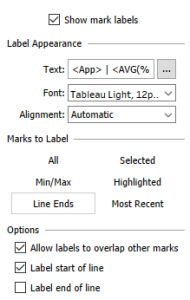
Now do the same for the second set of lines, but this time uncheck the box beside ‘Label start of line’ and remove App from Label so you are left with the AVG(% of Teens) on the right end of each line.
Here is where you should land. We now need to do some formatting. This is where Andy’s tip comes in.
Implementing Andy’s tip: To give our labels some space
The goal is to create room for the labels to fit in-line with the ends of each line. At present, the App labels are forced above or below the start of each line and AVG(% of Teens) looks a little tight.
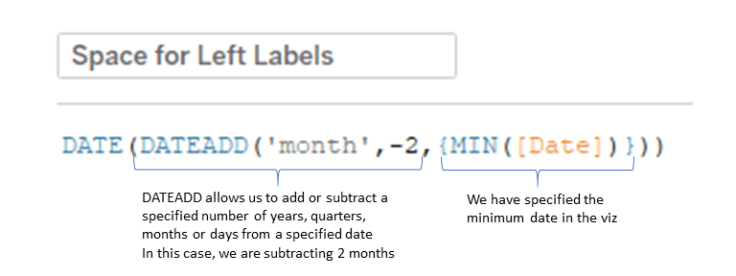
To make room for the App labels, we’ll start by creating a calculated field.
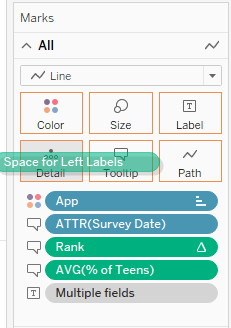
Convert the calculated field to continuous, drag onto Detail and set to Month.


We’ll then need to add a reference line to the horizontal axis.
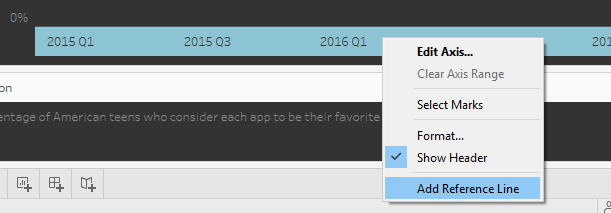
Set value to MONTH(Space for Left Labels), Label to None, Line to None and uncheck the box beside ‘Show recalculated line for highlighted or selected data points’. We don’t want the reference line to be visible; we want Tableau to account for this calculated date when determining the starting point on the horizontal axis, but we don’t want our audience focusing on some reference line that would to them appear to be random.

Here is our view when Tableau accounts for a date two months prior to the min date in the view. We now have enough space for our labels to fit in-line with our lines.

I should point out that two months worked in this case, but two months is not a magic number. It took some trial and error to land on two months. You could also create a parameter, as Andy points out in his video, to make the spacing dynamic.
While there appears to be enough room for the labels on the right in the above view, formatting the labels will result in off-center/overlapping labels. I followed a similar approach to create more room on the right side of the viz.


Tying-up a few loose ends: We have a few more steps before publishing
First, I don’t like how the 0% label is off-center from the 0% line. In fact, the first time I published this viz I left the 0% as is and Andy called me on it during #MMVizReview. I didn’t see the misalignment before he mentioned it, and now can’t unsee it.
So, how do you fix it? Simple. Right-click the vertical axis, select Edit Axis, set to Fixed and adjust the starting point to -0.02.

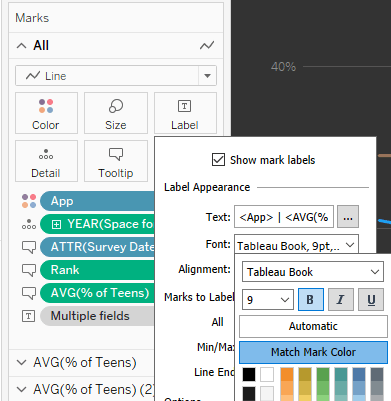
The next step is a matter of preference for me. In this case, I like setting the labels to match the color of the lines. I designed this viz with Snapchat’s brand colors in mind. Hence, the heavy use of yellow and black. It seems incomplete to leave the labels white.
To set the labels to match the lines, make sure you select All on the mark pane, click Label, Font and then Match Mark Color.
I also adjusted fonts and font sizes, but I believe those updates are simple enough and do not require instruction.
For those curious about how I initially solved for the spacing issue – I had set the horizontal axis to a fixed range and tried different start and end dates until the labels fit the dimensions of my dashboard. My solution works just fine and functions quite like Andy’s solution in this example; however, Andy’s method can easily flex via parameters for drilling up and down from year to quarter to month and so on.
Why did I pivot and use Andy’s method? Because Andy’s method scales to other scenarios (scenarios, that I now plan to explore!) WATCH ANDY’s VIDEO!!!!
Thanks for reading! Find me on Twitter @RelatableData.

Leave a comment