
Custom Hierarchies
Thanks so much to Paul for inviting me to write a guest post on his blog! He’s been a great coworker and mentor to me for the past few years, I have learned so much from him!
I’m a data analyst working in a People Analytics group analyzing human data. We deliver insights that inform strategic decisions that impact the firm’s workforce. I’ve always loved exploring data, prepping with tools like Alteryx and ultimately presenting visually through Tableau.
- For the audience that wants it all!
- Defining the Problem
- My solution
For the audience that wants it all!: Literally, all the data
I recently designed a dashboard for an audience of ~30 people who each show the same data in their work, but who each group the data a little differently. For example, one person will show data by Region and State, while one would want only Region, while another will show it by something unrelated to location. One person may show in complete aggregate.
To handle the ability to group by virtually any field(s) desired, I built what I now refer to as a “Custom Hierarchy” with parameters. This allows the user to select 1-3 “grouping” fields for their data.
The fun didn’t end there… once I created the grouping parameters, the data within the fields needed to be sorted differently! Some z-a, some a-z and some custom. I couldn’t find any articles or blog posts about custom sorts on parameters, so I combined a few pieces of advice I found about sorting individual fields. I’m hoping this post helps people to use this method to sort parameters!
Defining the Problem: Custom Sorting Multiple Parameters
As mentioned, my audience wanted to have the parameters sorted differently depending on the field selection – some would be a-z, some z-a, and some a custom sort. Adding some complexity was the fact that some fields were bins of numbers, so manually sorting these would 1) take FOREVER and 2) not be dynamic for any new bins that may be added to the data.
As I searched, I didn’t really find anything that applied to parameters, but did find some guidance on creating calculated fields to sorts individual fields. So, I decided to adapt these to suit my parameters, and all the potential field values that could be displayed.
My solution: A Calculated field to sort any value the parameter may hold
Here are the steps I took:
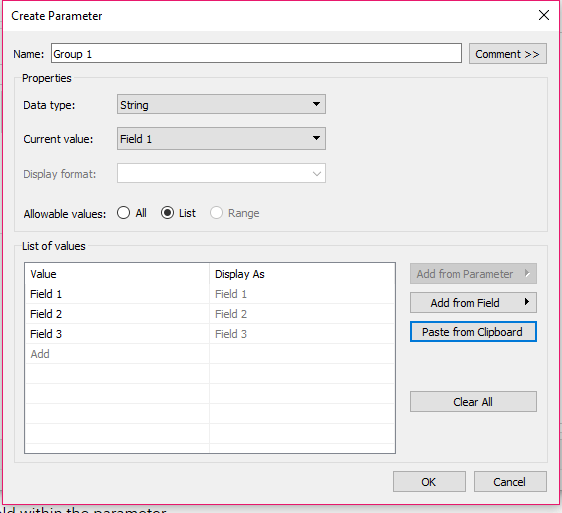
- Create as many Parameters as you need for grouping columns or rows
As you’re creating the parameters, list each of the possible selections in excel. You can then copy/paste these into the parameter, and you’ll use these again later in the process:
| Field Name |
| Field 1 |
| Field 2 |
| Field 3 |
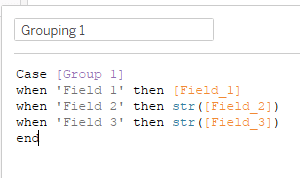
- Create a calculated field in Tableau (I called mine Grouping 1) to populate based on the parameter selection.
In your excel sheet, next to the Field Name for the Parameter drop-down, list your data-source field name
You can easily bring a formula into a new column to build the case statement logic
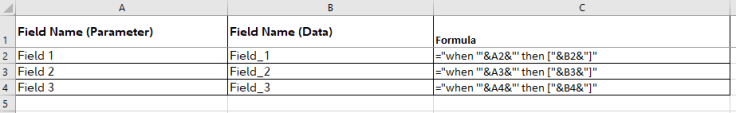
Copy this into the Grouping 1 calculated field. (In this example, some fields are whole numbers, I transformed them into strings as we need all string data types to display in the parameter)
- Determine sort order
Custom Sort:
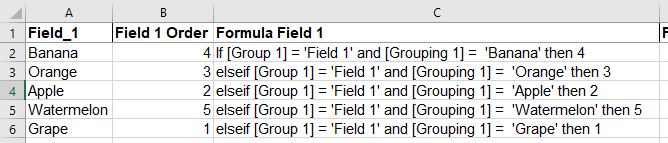
In order to do a custom sort, you first must determine all the values that could populate for each field within the parameter. Add these to a new excel sheet under the field name:
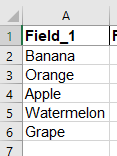
I suggest adding all the values that could appear in the data, not just the ones that are in the data. In the example above, I may add Peach, Grapefruit, etc., even though they’re not yet in my current data source. This is pretty easy to do with numeric fields in excel, I wrote some formulas that reference the previous rows’ data and added bin size.
What if the customer wanted to sort based on the size of each piece of fruit? Create a column and manually enter the order you’d like the data to display in, then create your formula text. Add the field and parameter names into the formula in the event that there is overlapping data in the fields (Note the first row of the formula has to contain If, the rest have to contain Elseif):
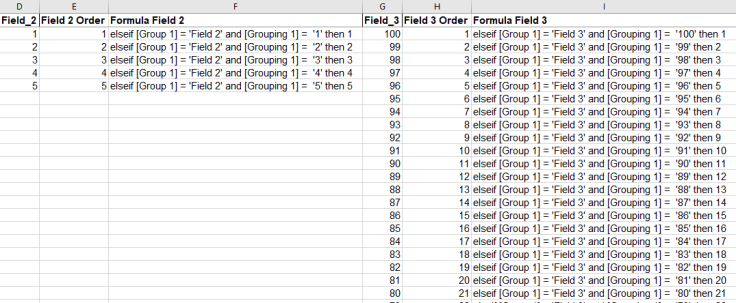
A-Z/Z-A Sorts:
Repeat this process for numeric sorts – I have one that goes high to low as well as a low to high:
Create a calculated field to sort your grouping field. Copy all the formula text from each field into one long if statement:
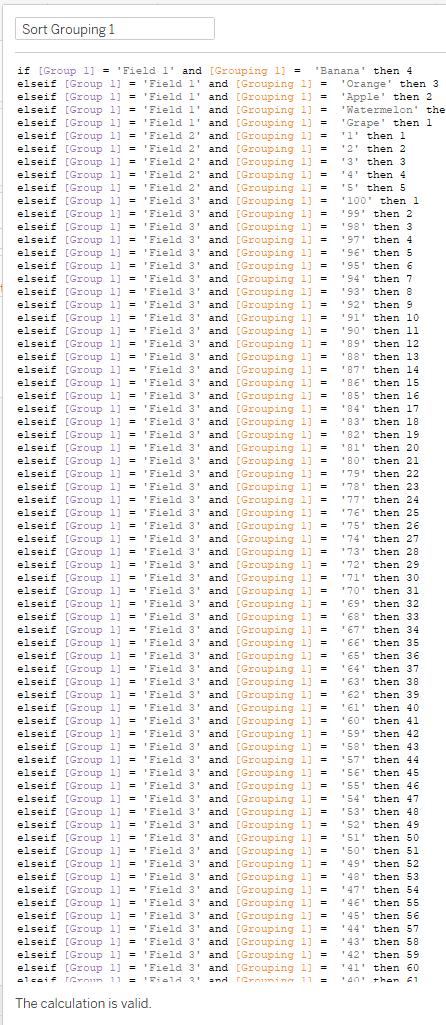
This will result in a measure; convert it to a dimension. Then add a default sort, either Ascending or descending: Right click>Default Properties>Sort>Ascending
- Add sort field to the view
Add the Grouping Field(s) to your view. The sort field(s) will need to go to the left of your Grouping field(s). If you have more than 1 grouping, put the sort to the immediate left of each grouping field, then you can click on the Sort Grouping pill, and unclick Show Header (I kept the header in the images below for clarity).
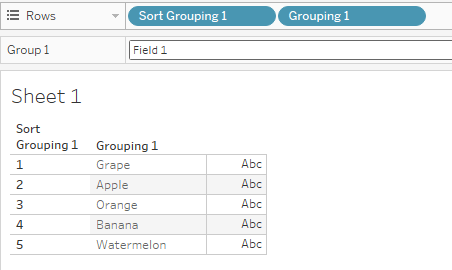
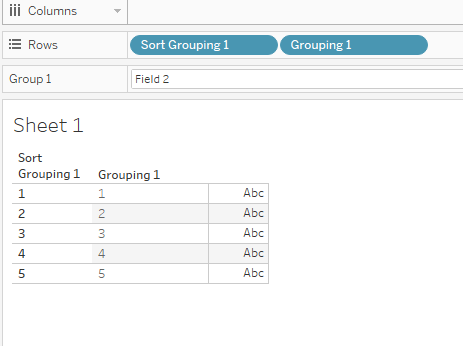
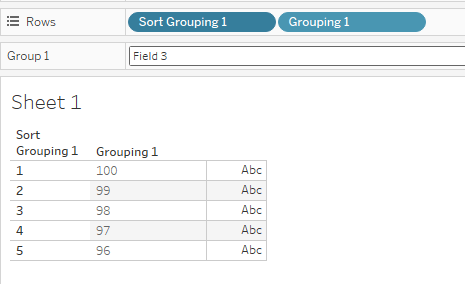
Each of the fields selected sorts in the way the audience wants!
Some other use cases for this (besides numbers and fruit sizes):
- Showing basketball players by jersey number low to high when grouping by number, but by height high to low when grouping by height
- Grouping states by region rather than alphabetically
- When sorting song by genre sort A-Z, and by decade (Z-A) when grouping by year
Thanks for reading! Connect with me on Twitter: @susannalytics

Leave a comment