
As I’ve chipped away at moving my users from static pdfs to interactive dashboards, one big win for me was adding the ability to toggle labels on and off to my dashboards. For some of my users, my dashboards are looked at as automated PowerPoint slides. They use the filters to create the views they need, export an image, and, voila, they are ready to distribute pdfs.
These users have different needs than those who interact directly with the dashboard.
One particular point of contention was their need to label every point in the chart, and my desire to reduce the amount of labels for my interactive users. I found my solution when it occurred to me that I could create a sheet swap, allowing the users to toggle labels on and off.
If you already know how to build a sheet swap, then there you have it. Maybe this is a familiar concept with a new application and you just had your own light-bulb moment similar to my own. Or maybe you know another way to achieve the same outcome. If so, I would love to hear from you; please reach out.
For those interested in a brief introduction to sheet swaps, please read-on.
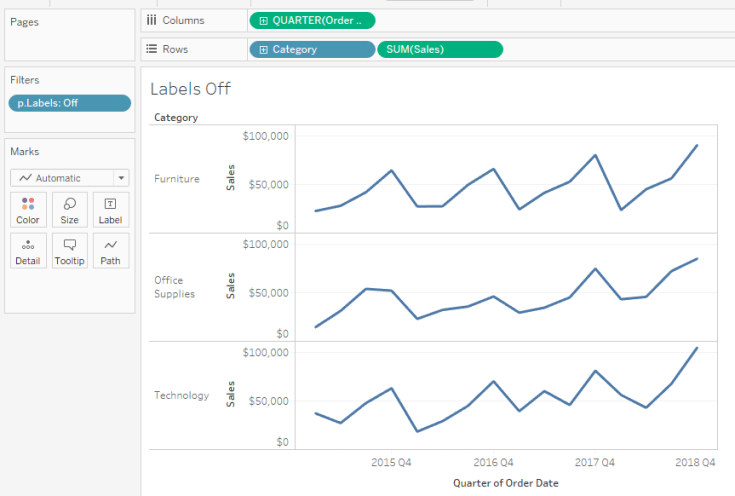
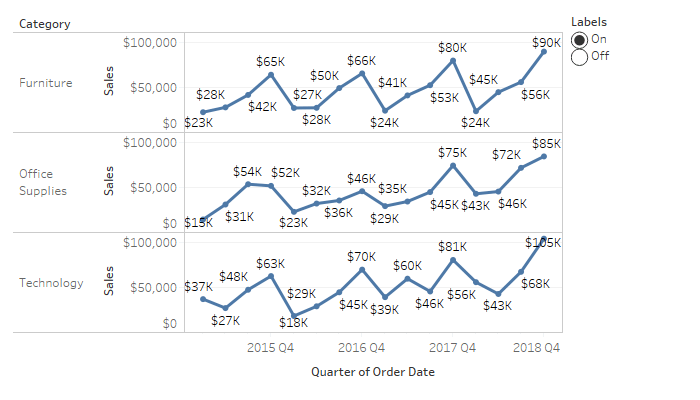
Step 1, build your viz with no labels, complete with all formatting. For this example I’ve used the Superstore data and kept formatting to a minimum. If I were building an actual dashboard, I would finalize all formatting in my dashboard before continuing on.
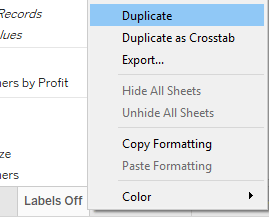
Step 2, once you’re satisfied with the dashboard layout and all formatting, duplicate the viz that needs to be toggled. Add labels and format.
Step 3, build a parameter and calculated field that references the parameter.


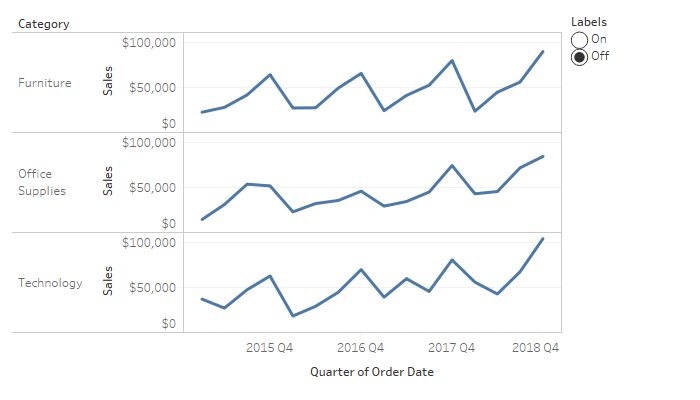
Step 4, show the parameter control on both vizzes. On the viz with labels, add the calculated field to filter self and check ‘On’. On the viz with no labels, again add the calculated field to the filter shelf and this time check ‘Off’. To test, toggle the parameter on and off to observe the viz toggle on and off.
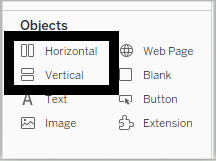
Step 5, place both vizzes in a container on the dashboard. It is important that both vizzes end up inside the same container; though, how you accomplish this depends on the containers and layout you are using.
However you proceed, you will temporarily end up with a less than appealing view.

Follow these steps to wrap things up:
- Turn off headers in both vizzes
- Set both vizzes to ‘Entire view’
- Add the parameter to the dashboard (if it is not already there)
- Set to radio buttons (this is my preference)
- Test
Hope you found this post to be useful. Thanks as always for reading!
Paul
